Checked every 5 minutes

Executive digital performance report
The Happy Customer Channel
Episode discovery and website audience growth
Mar-Aug 2026 organic sessions197Visits attributed to unpaid search+6466.7% vs Feb 2026
Reporting window
Website Reliability
Downtime window: Mar 1, 2026 - Aug 10, 2026The Happy Customer Channel Website Reliability
Current monitor status and downtime incident reports for the selected reporting window.
Rolling monitor health
Current monitor average
Downtime only
Microsoft Clarity
Microsoft Clarity | Aug 16, 2026-Aug 19, 2026 | Latest capture in selected rangeHomepage Behavior
Homepage behavior points to episode discovery, audience retention, and follow-path clarity.
1 homepage URL variant
12 sessions
8 sessions
Dead, rage, error, and quickback clicks
Weighted homepage scroll depth
0 bot sessions flagged
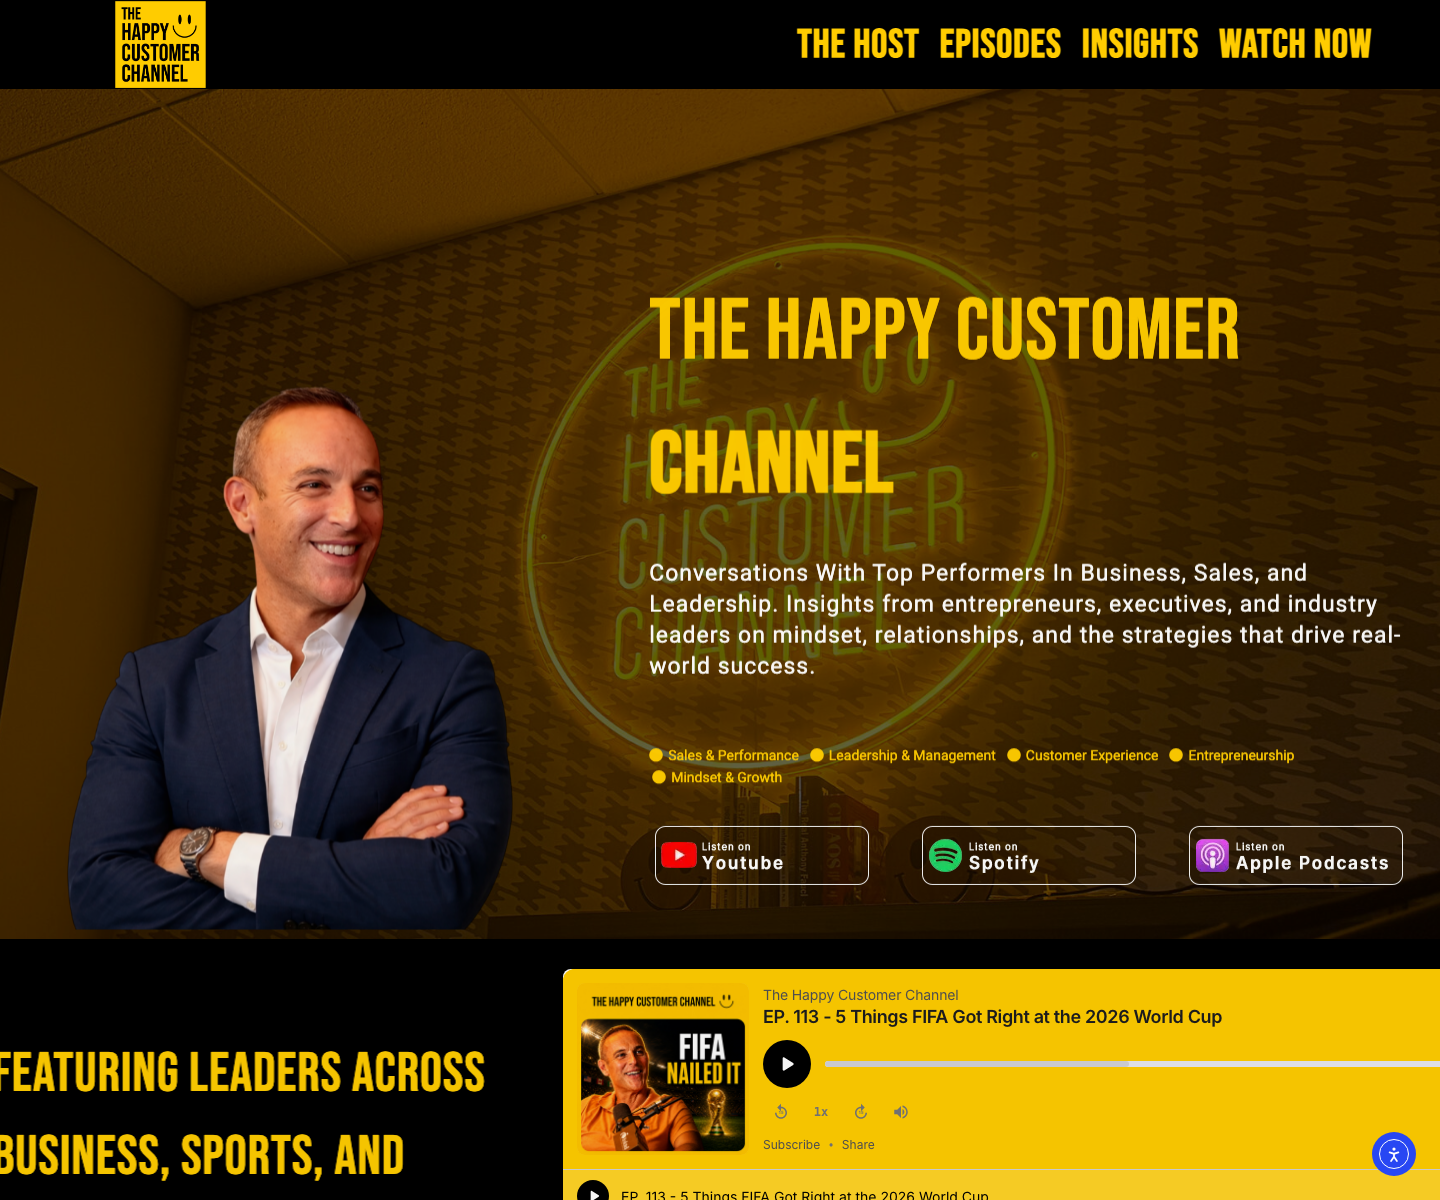
Homepage click map
Most active homepage zones
12
9
6not in screenshot section
0
33not in screenshot section
Website screenshot captured Aug 6, 2026. Real THCC homepage screenshot with Clarity aggregate behavior mapped over the selected reporting window.
Hero / latest episode entry12 clicks
Click location: Hero / latest episode entryHeat is placed on the first-screen message and primary action area visible in the screenshot.
Navigation topics9 clicks
Click location: Navigation topicsHeat is placed on the header navigation path visible near the top of the screenshot.
Episode archive bridge6 clicks
Click location: Episode archive bridgenot in screenshot sectionThis click path sits below the captured screenshot area, so the heat signal is anchored near the bottom and marked for context.
Video / podcast CTA0 clicks
Click location: Video / podcast CTAHeat is placed on the visible contact or next-step action area in the screenshot.
Follow / newsletter path33 clicks
Click location: Follow / newsletter pathnot in screenshot sectionThis click path sits below the captured screenshot area, so the heat signal is anchored near the bottom and marked for context.
User journey insights
Homepage path
Arrive
The first screen should make the newest episode, archive, and follow path obvious.
Orient
Source and device mix show whether visitors are arriving from owned audience pushes or discovery paths.
Evaluate
Script and click-friction signals identify where the episode journey may need technical cleanup.
Choose next step
Watch, listen, archive, and subscribe routes should sit close enough together to support repeat audience behavior.
Scroll depth pathEstimated users by page depth
25%10 users
Estimated from 32.6% avg scroll depth
50%4 users
Estimated from 32.6% avg scroll depth
75%2 users
Estimated from 32.6% avg scroll depth
100%1 users
Estimated from 32.6% avg scroll depth
Modeled from exported average scroll depth because the current Clarity snapshot does not include raw per-user scroll buckets.
Google Analytics 4
GA4 Organic SearchSEO | AEO | GEO | SEM
Organic acquisition, audience quality, and landing-page performance.
New users
111Brand-new visitors to the site+3600.0% vs Feb 2026Returning users
10Visitors who returned within 90 daysNew vs Feb 2026Engaged sessions
103Qualified visits with meaningful interaction+5050.0% vs Feb 2026Avg engagement / session
40.8sActive attention per organic visit+240.4% vs Feb 2026Mar-Aug 2026 trend
Traffic and engagement
52.3% of Mar-Aug 2026 organic sessions produced meaningful engagement.
Audience composition
New and returning users
91.7% of identified Mar-Aug 2026 users were new to the site.
Attention quality
Average engagement time
Mar-Aug 2026 organic visitors generated 40.8 seconds of active attention per session.
Landing-page acquisition
Top pages: Mar-Aug 2026 vs Feb 2026
Homepage generated 26.4% of Mar-Aug 2026 organic sessions.
Traffic acquisition
GA4 all trafficSource / medium mix
Direct / None represents 89.8% of measured Mar-Aug 2026 users.
Channel movement
Top 8 by sessionsTop source / medium trends
Direct / None is the top source / medium with 6,482 sessions, +26908.3% vs Feb 2026.
Page-level detail
GA4 Organic Search | Mar-Aug 2026Organic landing pages
| Landing page | Sessions | MoM | Users | Engagement rate | Avg engagement |
|---|---|---|---|---|---|
| Homepage/ | 52 | New | 33 | 63.5% | 37.5s |
| /ep-114-sopranos-superfan-jewelry-brand-daniel-acosta//ep-114-sopranos-superfan-jewelry-brand-daniel-acosta/ | 15 | New | 15 | 13.3% | 5.5s |
| /unsubscribe/?email=(redacted)/unsubscribe/?email=(redacted) | 9 | New | 6 | 33.3% | 143.5s |
| (not set)(not set) | 8 | New | 3 | 0.0% | 0.0s |
| /ep-113-5-things-fifa-got-right-2026-world-cup//ep-113-5-things-fifa-got-right-2026-world-cup/ | 6 | New | 6 | 66.7% | 6.7s |
| /host//host/ | 5 | New | 5 | 60.0% | 27.2s |
| /blog//blog/ | 3 | New | 2 | 66.7% | 7.3s |
| /episodes-archive/ep-46-nelson-flores-giacometto-buena-vista-creative-agency-life-hospitality-cannabis//episodes-archive/ep-46-nelson-flores-giacometto-buena-vista-creative-agency-life-hospitality-cannabis/ | 3 | New | 3 | 66.7% | 15.0s |
| /miami-football-culture-the-mecca-traz-powell//miami-football-culture-the-mecca-traz-powell/ | 3 | New | 1 | 66.7% | 1.0s |
| /ep-113-5-things-fifa-got-right-2026-world-cup-2//ep-113-5-things-fifa-got-right-2026-world-cup-2/ | 3 | New | 2 | 100.0% | 10.5s |
| /hosted-by-dan-arriola//hosted-by-dan-arriola/ | 2 | New | 2 | 50.0% | 17.0s |
| /ep-112-fiu-baseball-winning-culture-juan-alvarez//ep-112-fiu-baseball-winning-culture-juan-alvarez/ | 2 | New | 2 | 50.0% | 82.5s |
| /episodes-archive/ep-15-luis-wicho-hernandez-of-coastal-wealth-business-lessons-from-the-dugout//episodes-archive/ep-15-luis-wicho-hernandez-of-coastal-wealth-business-lessons-from-the-dugout/ | 1 | New | 1 | 0.0% | 0.0s |
| /404//404/ | 1 | New | 1 | 100.0% | 2.0s |
| /christopher-hunter-koia-entrepreneurial-journey//christopher-hunter-koia-entrepreneurial-journey/ | 1 | New | 1 | 100.0% | 16.0s |
What matters this month
Positive
Organic sessions increased 60.0%, engaged sessions more than tripled, and the homepage generated 62.5% of June organic traffic.
Needs attention
New-user volume declined from 21 to 13, and the small traffic base makes percentage movement volatile.
Game plan
Strengthen episode metadata and internal links, build search-led topic pages, and convert video discovery into repeat website visits.
SEO | AEO | GEO | SEM
Ahrefs Site ExplorerOnline Visibility
US organic estimates in subdomains mode. Detailed metrics use the July 27, 2026 snapshot; trend points use monthly snapshots.
Domain Rating
0.7Backlink authority benchmark, scored 0-100Authority score out of 100Ranking keywords
5US queries with a current organic rankingCurrent US keyword snapshotTraffic value
$44Estimated paid-media value of equivalent SEO traffic74 estimated visitsAI Overview exposure
80.0%Tracked results displaying an AI Overview4 of 5 keyword SERPsAuthority trend
Domain Rating
Domain Rating is 0.7, indicating the relative strength of the backlink profile.
Ranking depth
Keyword visibility by tier
1 keywords currently hold a top-three position in the monthly visibility trend.
Estimated search value
Organic traffic and traffic value
Estimated traffic value is down 11.2% from the prior monthly snapshot.
Monthly movement
Keyword changes
1 keywords entered or improved, versus 2 that declined or were lost.
Competition profile
Keyword difficulty mix
20.0% of tracked keywords sit in the easiest difficulty tier.
Search-result landscape
SERP feature exposure
AI Overviews appear on 80.0% of tracked keyword result pages.
AI search footprint
AI SERP presence
4of 5 tracked results
- Exposure
- 80.0%
- Trend status
- Baseline
AI visibility is established as a baseline; citation growth will be measured in the next reporting cycle.
Page authority
Focused 0-10 view; Ahrefs UR uses a 0-100 scaleTop-page URL Rating
Homepage has the strongest measured URL Rating among the reported organic pages.
Latest 30-day comparison
Jun 25, 2026-Jul 25, 2026Keyword Movement
Improved1
Declined2
| Keyword | Growth trend | Position | Delta | Volume | KD | Est. traffic | Ranking page |
|---|---|---|---|---|---|---|---|
| Keyword Changes3 | |||||||
| customer channel | Growing | #6 | +3 positions | 10 | 2 | 1+1 vs prior | Homepage |
| happy customer | Declining | #22 | -20 positions | 2,200 | 22 | 1-182 vs prior | Homepage |
| happy customers | Declining | #30 | -11 positions | 600 | 28 | 0-1 vs prior | Homepage |
Position improvements use lower ranking numbers as positive movement. Volume, difficulty, traffic, and ranking pages come from the same Ahrefs comparison snapshot.
What matters this month
Positive
Four of five tracked keyword results display AI Overviews, and estimated organic traffic remains near the June level.
Needs attention
Domain Rating is 0.7 and only five keywords are tracked, leaving search visibility highly exposed to small ranking changes.
Game plan
Rebuild authority through relevant links, strengthen episode-page schema and internal linking, and expand searchable topic coverage.
Content | Audience | Discovery
YouTube Analytics APIVideo Performance
Selected YouTube Analytics window: March 1-August 17, 2026.
Views
1,424,354Total video starts in the selected windowSelected reporting windowWatch time
9117.7 hrTotal hours of audience attentionSelected reporting windowAvg view duration
42 secAverage watched time per video viewPer measured viewSubscribers
27,100Current audience following the channelNet -411 for the periodDaily views by format
Shorts drove the volume spike
Shorts generated 94.0% of measured format views during the selected window.
Format performance
Views and watch time
Shorts39.616152052726754s average view duration
- Views
- 1,338,220
- Minutes
- 503,763
Long-form47.09466335207472s average view duration
- Views
- 86,084
- Minutes
- 42,787
Long-form average view duration remains useful context beside Shorts volume.
Top content
Most viewed videos

Dinner at Vesuvio: Which Sopranos Character Are You Choosing?462,551 views | 217,475 minutes watched
The leading video generated 32.5% of all channel views in the selected window.
Discovery mix
Traffic source views
Advertising supplied 98.1% of total views in the selected window.
Audience profile
Age and gender mix
Female 20.4%Male 79.2%GenderUserSpecified 0.4%
Audience mix uses the returned YouTube demographic snapshot for the selected window.
What matters this month
Positive
Shorts are creating top-of-funnel reach, and the selected window now drives the YouTube cards and trend charts.
Needs attention
Subscriber movement, average view duration, and ad-reliant discovery should be reviewed beside the selected range.
Game plan
Pair top Shorts with subscribe prompts, end screens, long-form follow-ups, and search-led episode pages that convert reach into retained audience.
Audience | Generic interests | YouTube API
YouTube API | Generic audience categoriesAudience Interest Signals
Data pull: August 10, 2025-August 7, 2026. YouTube API signals grouped into broad audience categories similar to what you would expect in a Google audience dashboard.
Category model
API-derivedGeneric Google-style audience labelsNo comment data includedTotal views
1,567,746Channel views in the complete YouTube Analytics windowAPI returned complete rows through Aug 7, 2026Search views
33,858Views attributed to YouTube SearchTop categorized search-detail rows explain 8,690 viewsAudience core
25-44Largest returned age block54.2% ages 25-44 | 79.8% male | 79.0% US viewsCurrent read
Generic interests favor entertainment
The generic audience-interest view points first to Media & Entertainment, then Sports & Fitness. Business, leadership, and customer-experience interests are present, but they show up more through viewed content than through direct YouTube Search behavior.
YouTube Analytics did not return native Google Ads-style affinity or in-market segments for this channel pull, so these categories are mapped from YouTube API search-detail rows and top viewed video rows. Comments and manual comment themes are excluded.
YouTube Search detail
Generic search-interest categories
These bars group API-returned YouTube Search detail rows into generic audience-interest categories. Comments are not included.
Top viewed videos
Generic viewed-content categories
These lanes are grouped from API-returned top video rows and video titles into Google-style audience categories.
Source note
API mapped categories
Google-style labels
The visible labels are intentionally broad: Media & Entertainment, Sports & Fitness, Business Services, Music & Audio, Health & Wellness, and Shopping & Apparel.
YouTube API signal underneath
The numbers come from YouTube API search-detail rows and top viewed video rows. Comment analysis is not part of this section.
Audience profile
API demographic anchors
Demographics are audience profile signals, not interests, but they help frame who the visible interest signals are coming from.
What matters this month
Positive
Media & Entertainment and Sports & Fitness are the clearest generic audience-interest categories in the YouTube API signals.
Needs attention
Business Services, Customer Experience, Shopping, and Apparel are weaker as direct audience-interest signals in the current pull.
Game plan
Use entertainment or sports packaging as the front door, then connect the episode back to business, leadership, customer experience, or growth once attention is earned.
Social Media | Meta
Meta Business SuiteFacebook and Instagram
The Happy Customer Channel Facebook and Instagram reporting from Meta Business Suite. Facebook activity covers Jul 1-Jul 28, 2026; reach and publishing cover Jul 19-Jul 25, 2026.
Meta page performance
Facebook Data


Meta Instagram performance
Instagram Data
Facebook watch-depth rows use total watch time divided by video views as a directional benchmark. Native 10%, 25%, 50%, 75%, and 100% retention events will replace the benchmark when the Meta media-level source is connected for Facebook and Instagram.
What matters this month
Positive
THCC produced the strongest connected Meta signal, with about 4.6K combined platform reach last week and 31 published posts.
Needs attention
Reach was heavily concentrated on July 22 and July 24, so consistency and retention should be watched alongside volume.
Game plan
Keep the short-form posting cadence active, isolate the topics driving reach spikes, and connect post-level reporting when app review opens deeper Meta metrics.
Paid Media | Meta Ads
Meta Ads ManagerMeta Campaign Performance
Campaign setup and delivery reporting for Apr 1, 2026-Sep 16, 2026. Spend renders as bars; impressions, reach, and clicks render as trend lines once Meta delivery rows are present in the reporting sync.
Delivery trend
Apr 1, 2026-Sep 16, 2026Spend, Impressions, Reach and Clicks
Spend is the paid media cost in the selected window; impressions show ad exposures, reach shows unique audience exposure when Meta supplies it, and clicks show traffic actions from the ad. For this landing-page-view campaign, Meta may supply landing page views before raw link-click totals are available.
Audience response
Live age results | configured interestsAge and Interest Signals
This block is date-aware and renders when a paid Meta campaign overlaps the selected reporting window. Age response is based on visible Meta landing-page-view results; interest rows remain the configured launch targeting until Meta exposes a supported interest-performance breakdown.
Paid Media | Google Ads
Google Ads APIYouTube Ads
Campaign results follow the page's selected reporting window: Mar 1-Aug 8, 2026. Delivery diagnostics cover Apr 1-Jul 25, 2026.
Executive performance
11 campaigns with activityCampaign Results
Spend$17,834.36
Budget deployed across selected campaigns
Audience Presented To1,520,283
Times users were served the video ads
TrueView Views626,119
Qualified Google Ads video views
View Rate41.18%
TrueView views divided by impressions
Clicks and CTR1,964 clicks0.129% CTR
Landing interactions and click share
Cost Per View$0.0285
Spend required for each TrueView view
Cost Per Click$9.08
Spend required for each ad click
Audience Presented To uses impressions because unique-user reach returned zero for these campaigns in the Google Ads API.
Campaign flighting
Status reflects the latest account stateStatus, Active Dates and Spend
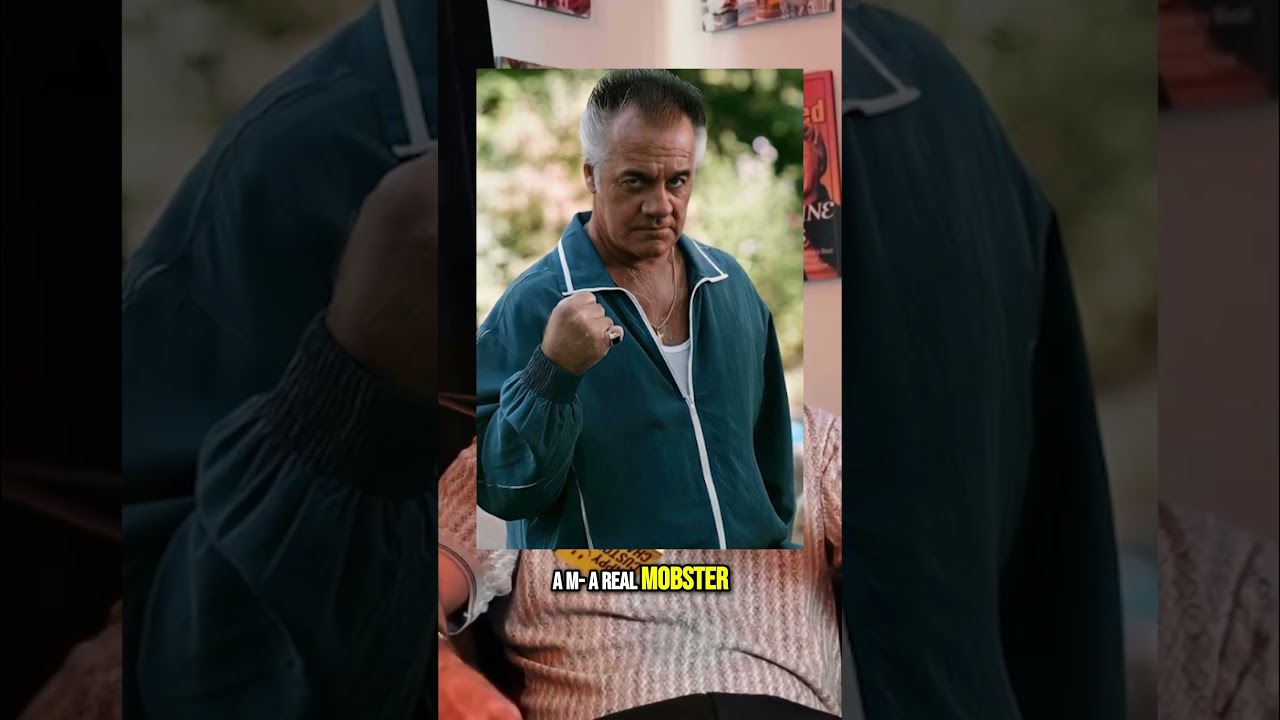
THCC - AUG 2026 - EP114 - Sopranos Superfan - Video ViewsMar 1-Aug 8, 2026Paused
$15,082.39selected-window spend
Eddy's BookApr 20-May 20, 2026Paused
$999.48selected-window spend
FIFA James OyolaJul 8-Aug 8, 2026Enabled
$391.49selected-window spend
GLP-1sJun 18-Jul 18, 2026Enabled
$200.33selected-window spend
Katie GoarJun 18-Jul 18, 2026Enabled
$200.17selected-window spend
Buying a BusinessJun 18-Jul 18, 2026Enabled
$200.08selected-window spend
Traz PowellJun 18-Jul 18, 2026Enabled
$200.08selected-window spend
About RelationshipsJun 18-Jul 18, 2026Enabled
$200.07selected-window spend
Seth Levit / Jay TaylorJul 10-Aug 10, 2026Enabled
$189.76selected-window spend
Friday Night LightsJun 5-Jul 5, 2026Paused
$86.33selected-window spend
AuctioneerJun 5-Jul 5, 2026Paused
$84.19selected-window spend
Creative retention
Apr 1-Jul 25, 2026 snapshotVideo Completion by Campaign
Katie Goar produced the strongest measured completion at every milestone, including a 9.2% full-view rate.
Delivery intelligence
Apr 1-Jul 25, 2026 snapshotAudience & Delivery
Performance by Device
Audience Presented To by device
Age and Gender
Presented impressions where data is sufficient
Age
Gender
Geographic Performance
Top states by Audience Presented To
Weekly Delivery
Spend as bars; TrueView views and trend as lines
Ad Format and Network
How presented impressions reached inventory
Format
Network
Audience-Segment Performance
Presented impressions by criterion type
Audience criteria can overlap and are directional, not additive reach.
YouTube Channels and Videos
Top reported placements by presented impressions
| Placement | Type | Presented | Views | Clicks |
|---|---|---|---|---|
| It’s Impossible to Tax a Trillionaire 😳 #short #shorts #stocks #business #taxes #investing #wealth | YOUTUBE VIDEO | 1,294 | 291 | 5 |
| Boeing CEO's Salary #wealthmindset | YOUTUBE VIDEO | 787 | 208 | 4 |
| Last To Leave Grocery Store, Wins $250,000 | YOUTUBE VIDEO | 656 | 13 | 0 |
| Unnamed placement | YOUTUBE VIDEO | 553 | 233 | 1 |
| A $26 million CEO payday while a customer is still fighting for her claim? In 2024, Allstate | YOUTUBE VIDEO | 511 | 105 | 1 |
| Do you still think you don't need a system? 😂 | YOUTUBE VIDEO | 491 | 87 | 2 |
| The product that blinded the sharks.#shopify #shorts #bestdealer | YOUTUBE VIDEO | 474 | 94 | 0 |
| The Story of IN-N-OUT BURGER #story #fastfood #storytime | YOUTUBE VIDEO | 436 | 135 | 1 |
Google Ads returned video-level placements for this period; no separate channel rows met the reporting threshold.
What matters this month
Positive
THCC - AUG 2026 - EP114 - Sopranos Superfan - Video Views led selected-window views, while Traz Powell delivered the lowest cost per view at $0.0182.
Needs attention
Auctioneer posted the lowest selected-window view rate at 3.4%, signaling a creative or audience-fit review.
Game plan
Prioritize efficient creative variants, review low-view-rate placements and audiences, and shift future budget toward campaigns with stronger view and click efficiency.